On May 21st, 2013, the S&P 500 Index reached its highest closing price in history at 1669.21. Given the mixed signals of many economic indicators, many of our clients are questioning the sustainability of the recent rally. This post will discuss whether the underlying fundamentals, especially earnings and profits, can continue to support the market at current levels and push it further. We will start by describing the current market valuation and where it stands relative to history. We will then take a look at profit margins, their relationship to other economic variables, and how they might look going forward. We draw much of our analysis from a white paper published by GMO.
Figure 1

Current Market Valuation
The primary fundamental driver of the market rally since 2009 has been strong growth in corporate earnings. Coming out of the “Great Recession,” companies have looked for ways to reduce their costs and boost margins so as to be leaner and better positioned to drive corporate earnings once an economic recovery takes hold. During this recovery, prices have risen as strongly as earnings resulting in a relatively stable P/E ratio. The question now is whether the market is fairly valued.
For our analysis, we will use the 10-year inflation-adjusted price earnings ratio, which is commonly known as CAPE10, a tool developed by Robert Shiller of Yale University. In March 2013, the CAPE10 figure was 22.52. That was higher than its long-term average of 18.30 (see Figure 2) but within +1 standard deviation.
Figure 2

In addition, the most recent CAPE10 figure ranks in the 82nd percentile relative to its post-war history (see Figure 3). As a point of reference, only the tech-bubble has produced a higher CAPE10. A quick glance of both analyses suggests that current valuation is more expensive relative to history.
Figure 3

However, due to certain technical limitations of using a simple average to draw conclusions about the data over long time periods, we believe reviewing the CAPE10 under different economic regimes, and attributing the dynamics of those regimes to the behavior of the CAPE10, is a prudent supplement to the simple average. In Table 1 below, we define economic regimes by year-over-year GDP growth and inflation ranges. The Philadelphia Fed survey projects that GDP growth will stand between 2.0% and 3.0% per year over the next four years. Meanwhile, inflation is projected to be around 2.3% per year over the next four years. Given those conditions, and based on historical data, the CAPE10 is expected to average 21. With the CAPE10 at 22.52 as of March 2013, the market is slightly expensive relative to history. However, we think it is reasonable.
Table 1: CAPE10 under Economic Regimes

Profit Margins
Having established some context for the market’s valuation, our focus will now turn to profit margins, which are tied directly to, and have significant impact on, earnings. After-tax corporate profits as a percentage of GDP are currently about 75% above the historical mean. For our analysis, we use the National Income and Product Accounts data, which provides a broad measure of all corporate activity in the United States. While there continues to be an ongoing debate about the sustainability of profit margins at their current level, we believe that there is a strong possibility that there will be some level of mean reversion as the economy continues to heal and as monetary and fiscal policies get adjusted.
Figure 4

There are two ways to look at the dynamics of profit margins. One is the capital deepening theory, which looks at the relationship between capital, labor, and productivity (i.e. technology). The other is a sectoral view, which has been popularized by GMO. For the purposes of this post, and for simplicity, we will focus on the latter. The sectoral view relies on Kalecki’s profit equation, which uses national income accounting to derive a relationship between profits, investment, and savings. Kalecki’s profit equation is as follows:
Profits = Investment – Household Savings – Government Savings – Foreign Savings + Dividends
In other words, the deficit of one sector must emerge as the surplus of another.
Over the past decade, combined total household and government savings as a percent of nominal GDP has been trending down (Figure 5 shows an inverted scale). The government is running a huge deficit and the household savings rate is the lowest in history. The result of this behavior is that the government deficit gets treated as a positive contributing factor to profit margins (there is a double negative sign in front of it in the above equation) and the household savings factor is detracting from profits to a lesser degree than any time in history. As such, profit margins are at record levels.
Figure 5

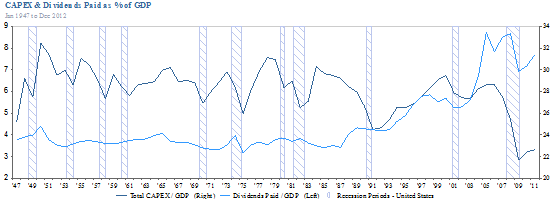
In the same manner that the reduction in household savings translates to an increase in government spending, so it is with the investment and dividend portions of the equation. In Figure 6 below, total capital expenditures as a percent of nominal GDP is compared to total dividends paid as a percent of nominal GDP. In order to have profit margins sustain themselves, it is necessary for corporations and households to invest in “real, productive assets,” such as property, plant, and/or equipment. However, as economic uncertainty has continued throughout the recovery, investment in productive assets has stalled and, in its place, dividends have been paid. The irony of this situation is that, as investment improves (which it has shown signs of doing), profit margins in the short term will have to contract as the investment takes time to begin generating a return.
Figure 6
Conclusion
There are, and have been, numerous fundamental and policy factors influencing market prices, earnings, and profit margins since the economic recovery began. We have discussed both factors broadly in the above piece and would highlight the following observations:
-
Businesses, thus far, have focused on reducing costs in the face of sluggish growth and uncertainty about future global economic conditions. This was the prudent decision as the recession took hold and as it has taken time for the recovery to fully materialize. However, going forward, capital is going to have to be put to productive use (as opposed to paying dividends or buying back shares) in order for earnings to increase and profit margins to remain robust. In order to get these outcomes, profit margins will have to contract as productive investments are made.
-
Fiscal policy has played a significant role in supporting the recovery and profit margins. Since the onset of the recession in 2008, the government has had to undertake expansionary fiscal policy initiatives in an effort to “plug the recessionary gap” in the economy. This has had significant impacts on profit margins and earnings and, at some point, will have to be reduced to address the deficit issues.
We believe that, based on the current business climate and fiscal policy situation, profit margins should move towards their mean in the near-to-medium term. Any such reversion will have a negative impact on both equity markets as well as fixed income markets but will be generally positive for all markets in the long term.
Source: GMO, BBH, PIMCO


